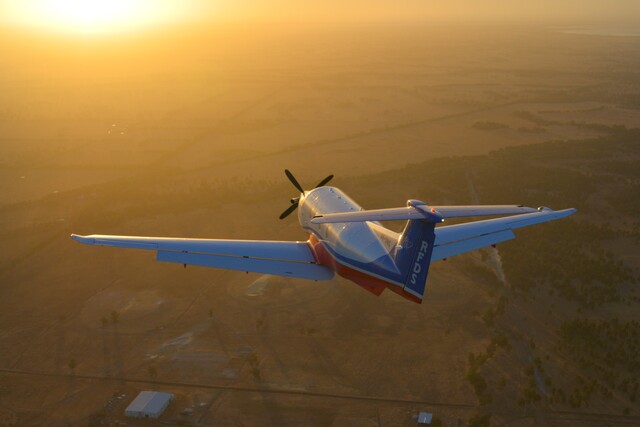
Barossa Council, South Australia, is working with Airborne Research Australia (ARA) to create initial heat maps of the Tanunda Urban Forest Project (TUFP) area.
The preliminary view of the area specifically looks at heat distribution variances between vegetated areas and those that aren’t.
The TUFP was established as an educational tool for schools and the community to view the local landscape through a climate lens and to further promote Tanunda’s greenspace and woody vegetation.
The Adelaide and Mount Lofty Ranges Natural Resources Management Education Officer, Chris Hall, in collaboration with The Barossa Council, created a map to show the volume and distribution of urban forest. It became the catalyst for action.
Action included ‘on-ground’ components, such as major plantings, connectivity between sites and the formation of a community group to support the new plantings, as well as ‘above-ground’ to influence attitude changes such as local schools incorporating the urban forest map into their curriculum as part of a broader climate initiative.
Heat mapping is a relatively new tool which identifies cooler and hotter areas of the landscape, helping to guide a strategic response to climate impacts at the local level.
Recent heat mapping of streets in the Adelaide suburb, Henley Beach, demonstrated an eight degree temperature difference between one street containing a leafy tree canopy on both sides, and neighbouring streets which lacked street trees.
It also showed the cooling effect of vegetation throughout the night.
The example of information and data provided by ARA to The Barossa Council could form part of a bigger project which would see Council looking at future climate change strategies throughout the region.


